Essay
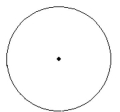
Fill in the table. Round to the nearest degree. Then draw a circle graph to represent the information given in the table.
- 
Correct Answer:

Verified
Correct Answer:
Verified
Related Questions
Q83: Twenty teenagers were asked to give
Q84: The bar graph shows the expenditures of
Q85: The circle graph shows the results of
Q86: Fill in the blank with one
Q87: Find the mean. If necessary, round to
Q89: Fill in the blank with one
Q90: Solve. If necessary, round answers to
Q91: Find the median. If necessary, round to
Q92: Find the mode or modes (if any).<br>-86,
Q93: The histogram shows the scores of each