Multiple Choice
The line graph shows the recorded hourly temperatures in degrees Fahrenheit at an airport. 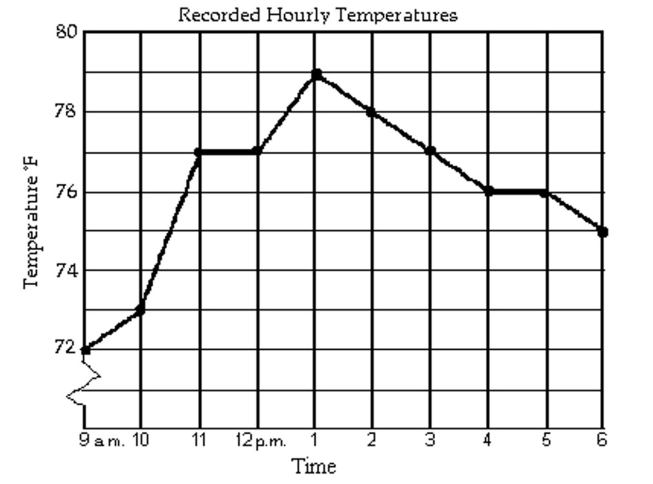
-At what time was the temperature the highest?
A) 11 a.m.
B) 2 p.m.
C) 1 p.m.
D) 5 p.m.
Correct Answer:

Verified
Correct Answer:
Verified
Related Questions
Q95: The histogram shows the scores of each
Q96: The double-line graph shows temperature highs and
Q97: The pictograph shows the number of bicycles
Q98: Fill in the blank with one
Q99: Suppose that the numbers 1 through
Q101: Find the mean. If necessary, round to
Q102: Find the mode or modes (if any).<br>-91,
Q103: The circle graph shows the results of
Q104: Solve. If necessary, round answers to the
Q269: Use the graph to solve the problem.<br>-During