Multiple Choice
The circle graph shows the results of the student council presidential election. The complete circular area represents
100% of the votes.
-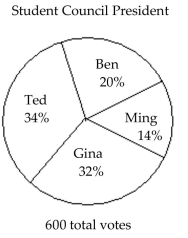 The circle graph shows what percent of the vote each person received. If 600 total votes were cast, how many votes did Ted get?
A) 120
B) 204
C) 84
D) 192
Correct Answer:

Verified
Correct Answer:
Verified
Q98: Fill in the blank with one
Q99: Suppose that the numbers 1 through
Q100: The line graph shows the recorded hourly
Q101: Find the mean. If necessary, round to
Q102: Find the mode or modes (if any).<br>-91,
Q104: Solve. If necessary, round answers to the
Q106: Find the probability of the event.<br>-If
Q107: Find the mode or modes (if any).<br>-5,
Q108: Find the probability of the event.<br>-If
Q269: Use the graph to solve the problem.<br>-During