Multiple Choice
The line graph shows the recorded hourly temperatures in degrees Fahrenheit at an airport. 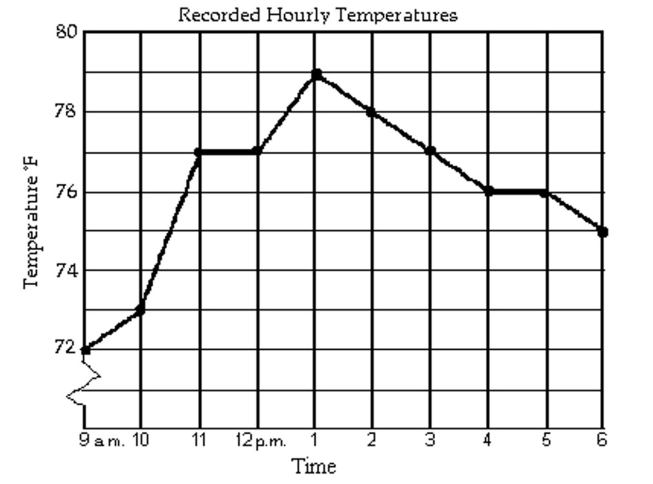
-At what time was the temperature 73°?
A) 5 p.m.
B) 9 a.m.
C) 10 a.m.
D) 10 a.m. and 11 a.m.
Correct Answer:

Verified
Correct Answer:
Verified
Related Questions
Q60: A deck of cards contains 52
Q61: The bar graph shows the expenditures of
Q62: Find the median. If necessary, round to
Q63: Find the median. If necessary, round to
Q64: Find the probability of the event
Q66: Draw a tree diagram to find the
Q67: Draw a tree diagram for the experiment
Q68: Use the information given to draw
Q69: The bar graph shows the number of
Q70: The double-line graph shows temperature highs and