Short Answer
The double-line graph shows temperature highs and lows for a week. 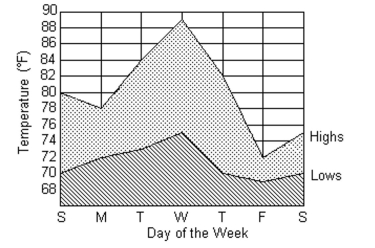
-What was the high temperature reading on Wednesday?
Correct Answer:

Verified
Correct Answer:
Verified
Related Questions
Q65: The line graph shows the recorded hourly
Q66: Draw a tree diagram to find the
Q67: Draw a tree diagram for the experiment
Q68: Use the information given to draw
Q69: The bar graph shows the number of
Q71: Draw a tree diagram to find the
Q72: The following pictograph shows the number of
Q73: The following pictograph shows the number of
Q74: The following pictograph shows the number of
Q75: The following circle graph displays Chris