Multiple Choice
Determine whether the graph could represent a variable with a normal distribution. Explain your reasoning. 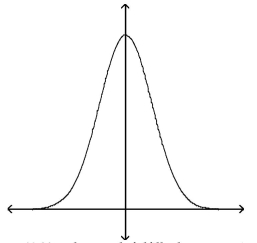
A) Yes, the graph fulfills the properties of the normal distribution
B) No, the graph is skewed left.
C) No, the graph crosses the x-axis.
D) No, the graph is not symmetric.
Correct Answer:

Verified
Correct Answer:
Verified
Related Questions
Q70: The graph depicts IQ scores of adults,
Q71: Find the area under the standard normal
Q72: Determine whether the graph could represent a
Q73: Find the area under the standard normal
Q74: Find the area under the standard normal
Q76: Use the standard normal distribution to
Q77: Compare the scores: a score of 75
Q78: Assume that the heights of men are
Q79: The distribution of cholesterol levels in
Q80: You are performing a study about