Multiple Choice
The graph depicts IQ scores of adults, and those scores are normally distributed with a mean of 100 and a standard deviation of 15. Find the probability that a member selected at random is from the shaded area of the
Graph. 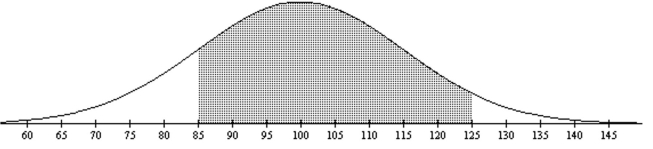
A) 0.7938
B) 0.7745
C) 0.7303
D) 0.7619
Correct Answer:

Verified
Correct Answer:
Verified
Related Questions
Q65: Provide an appropriate response. Use the Standard
Q66: Assume that the heights of women are
Q67: Match the binomial probability <span
Q68: In a certain normal distribution, 6.3%
Q69: For the standard normal curve, find the
Q71: Find the area under the standard normal
Q72: Determine whether the graph could represent a
Q73: Find the area under the standard normal
Q74: Find the area under the standard normal
Q75: Determine whether the graph could represent a