Multiple Choice
Determine whether the graph could represent a variable with a normal distribution. Explain your reasoning. 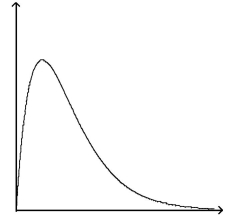
A) No, the graph is skewed right.
B) No, the graph crosses the x-axis.
C) No, the graph is skewed left.
D) Yes, the graph fulfills the properties of the normal distribution
Correct Answer:

Verified
Correct Answer:
Verified
Related Questions
Q37: The average number of pounds of red
Q38: Scores on a test have a
Q39: Find the area of the indicated region
Q40: The distribution of cholesterol levels in
Q41: The SAT is an exam used by
Q43: Assume that the random variable X
Q44: Find the area of the indicated region
Q45: Use a standard normal table to find
Q46: Assume that the salaries of elementary school
Q47: Assume that the heights of men are