Multiple Choice
Scores on a test have a mean of 72 and a standard deviation of 12. Random samples of size 64 are drawn from this population and the mean of each sample is determined. Use the Central Limit Theorem to find the mean
And standard error of the mean of the sampling distribution. Then sketch a graph of the sampling distribution.
A) 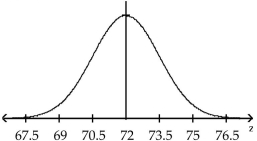
B) 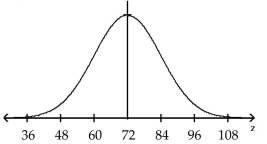
C) 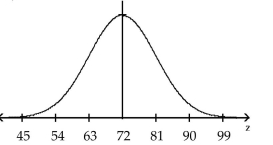
D) 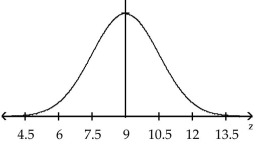
Correct Answer:

Verified
Correct Answer:
Verified
Q33: The ACT is an exam used by
Q34: For the standard normal curve, find the
Q35: Find the area of the indicated region
Q36: IQ test scores are normally distributed with
Q37: The average number of pounds of red
Q39: Find the area of the indicated region
Q40: The distribution of cholesterol levels in
Q41: The SAT is an exam used by
Q42: Determine whether the graph could represent a
Q43: Assume that the random variable X