Multiple Choice
Which of the following could be a cumulative frequency graph?
A) 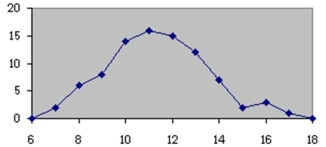
B) 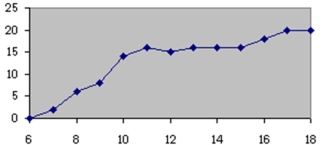
C) 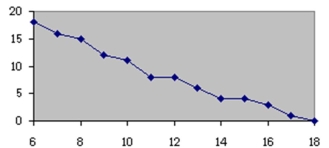 D
D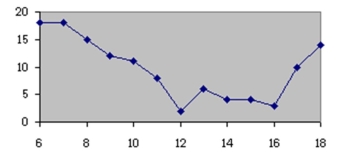
Correct Answer:

Verified
Correct Answer:
Verified
Related Questions
Q13: A pie graph would best represent the
Q28: If a frequency distribution had class boundaries
Q29: A histogram uses the midpoints for the
Q35: A time series graph is useful for
Q44: The _ is obtained by first adding
Q62: Given the following frequency distribution, how many
Q71: Exaggerating a one-dimensional increase by showing it
Q72: A Pareto chart arranges data from largest
Q74: Using the class 23-35, what is the
Q77: A grouped frequency distribution is used when