Multiple Choice
Given the following frequency distribution, how many pieces of data were less than 28.5? 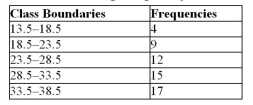
A) 12
B) 9
C) 25
D) 17
Correct Answer:

Verified
Correct Answer:
Verified
Related Questions
Q13: A pie graph would best represent the
Q35: A time series graph is useful for
Q44: The _ is obtained by first adding
Q56: A stem and leaf plot is useful
Q60: The graphs that have their distributions as
Q63: A pie graph is not useful to
Q63: The frequency polygon is a graph that
Q66: Which of the following could be a
Q71: Exaggerating a one-dimensional increase by showing it
Q77: A grouped frequency distribution is used when