Multiple Choice
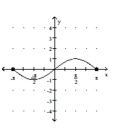
Determine whether the graph illustrated represents a function. Give the domain and range of the relation or function.
-
A) 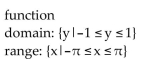
B) 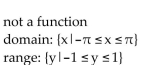
C) 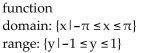
D) 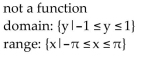
Correct Answer:

Verified
Correct Answer:
Verified
Q80: Graph the equation.<br>-<img src="https://d2lvgg3v3hfg70.cloudfront.net/TB8475/.jpg" alt="Graph the equation.
Q81: Evaluate the function for the indicated value.<br>-f(x)
Q82: Determine whether the graph illustrated represents a
Q83: Solve the problem.<br>-The cost C, in dollars,
Q84: The graph below shows the percentage of
Q86: Graph the equation.<br>-<img src="https://d2lvgg3v3hfg70.cloudfront.net/TB8475/.jpg" alt="Graph the equation.
Q87: The graph below shows the percentage of
Q88: Use the graph to find the value.
Q89: Solve the problem.<br>-The graph below shows the
Q90: Use a calculator to obtain at least