Multiple Choice
Solve the problem.
-The graph below shows the total sales of houses in a town from 2000 to 2005. The graph also shows the sale of houses in the summer , S, and in the other times of the year, Y. 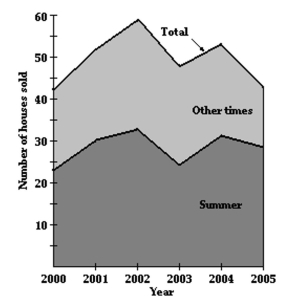 Estimate (S+Y) (2001) .
A) 59
B) 51
C) 45
D) 56
Correct Answer:

Verified
Correct Answer:
Verified
Q84: The graph below shows the percentage of
Q85: Determine whether the graph illustrated represents a
Q86: Graph the equation.<br>-<img src="https://d2lvgg3v3hfg70.cloudfront.net/TB8475/.jpg" alt="Graph the equation.
Q87: The graph below shows the percentage of
Q88: Use the graph to find the value.
Q90: Use a calculator to obtain at least
Q91: Graph the equation.<br>-<img src="https://d2lvgg3v3hfg70.cloudfront.net/TB8475/.jpg" alt="Graph the equation.
Q92: Graph the equation.<br>-<img src="https://d2lvgg3v3hfg70.cloudfront.net/TB8475/.jpg" alt="Graph the equation.
Q93: Solve the problem.<br>-If a line passes through
Q94: Graph the linear function by plotting the