Multiple Choice
Solve the problem.
-The graph shows the projected radio sales (in millions) for a particular company. 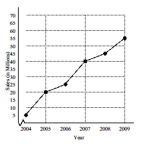 Determine the average rate of change from 2005 to 2008. Round to two decimal places if necessary.
A) 15
B) 5
C) 10
D) 8.33
Correct Answer:

Verified
Correct Answer:
Verified
Q26: Solve the problem.<br>-The graph below shows the
Q27: Find the equation of a line with
Q28: Solve the problem.<br>-In 1995, the average annual
Q29: Graph the equation.<br>-<img src="https://d2lvgg3v3hfg70.cloudfront.net/TB8475/.jpg" alt="Graph the equation.
Q30: Determine whether the two given lines are
Q32: Solve the problem.<br>-The population of fruit flies,
Q33: Determine if the relation illustrated is a
Q34: Provide an appropriate response.<br>-A relation is any
Q35: Graph the equation.<br>-<img src="https://d2lvgg3v3hfg70.cloudfront.net/TB8475/.jpg" alt="Graph the equation.
Q36: Determine whether the two given lines are