Multiple Choice
Solve the problem.
-The graph below shows the total sales of houses in a town from 2000 to 2005. The graph also shows the sale of houses in the summer , S, and in the other times of the year, Y. 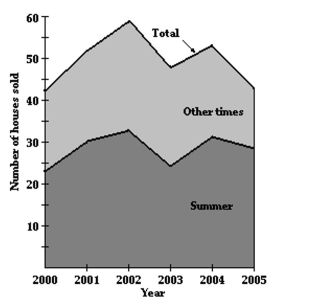 Estimate The number of houses sold at other times in 2002.
A) 34
B) 47
C) 23
D) 27
Correct Answer:

Verified
Correct Answer:
Verified
Q21: Illustrate the set on a number line.<br>-<img
Q22: Use a calculator to obtain at least
Q23: Solve the problem.<br>-The gas mileage, m, of
Q24: Determine whether the graph illustrated represents a
Q25: Express in set builder notation the set
Q27: Find the equation of a line with
Q28: Solve the problem.<br>-In 1995, the average annual
Q29: Graph the equation.<br>-<img src="https://d2lvgg3v3hfg70.cloudfront.net/TB8475/.jpg" alt="Graph the equation.
Q30: Determine whether the two given lines are
Q31: Solve the problem.<br>-The graph shows the projected