Multiple Choice
Solve the problem.
-The following graph shows the private, public and total national school enrollment for students for select years from 1970 through 2000. 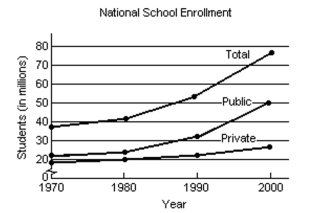 i) How is the graph for total school enrollment, T, determined from the graph of the private enrollment, r, and the
Public enrollment, u?
Ii) During which 10-year period did the total number of students enrolled increase the least?
Iii) During which 10-year period did the total number of students enrolled increase the most?
A) 
B) 
C) 
D) 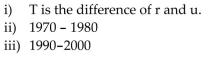
Correct Answer:

Verified
Correct Answer:
Verified
Q37: Determine whether the two given lines are
Q38: Find the equation of a line with
Q39: Evaluate the function for the indicated value.<br>-<img
Q40: Solve the problem.<br>-A truck rental company rents
Q41: Provide an appropriate response.<br>-The set of of
Q43: Solve the problem.<br>-Sue and Bob have each
Q44: Write the equation in standard form.<br>-8x =
Q45: Determine whether the graph illustrated represents a
Q46: Write the equation in standard form.<br>-y =
Q47: Solve the problem.<br>-The formula for changing Celsius