Multiple Choice
Solve the problem.
-Sue and Bob have each saved money during every year from 2000 to 2005. The following bar graph shows the amounts saved each of those years. 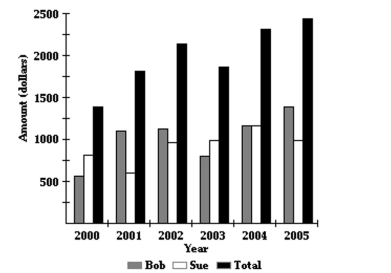 In 2001, estimate how much more Bob saved than Sue.
A) 800
B) 500
C) 900
D) 700
Correct Answer:

Verified
Correct Answer:
Verified
Q38: Find the equation of a line with
Q39: Evaluate the function for the indicated value.<br>-<img
Q40: Solve the problem.<br>-A truck rental company rents
Q41: Provide an appropriate response.<br>-The set of of
Q42: Solve the problem.<br>-The following graph shows the
Q44: Write the equation in standard form.<br>-8x =
Q45: Determine whether the graph illustrated represents a
Q46: Write the equation in standard form.<br>-y =
Q47: Solve the problem.<br>-The formula for changing Celsius
Q48: Find the requested value.<br>-<img src="https://d2lvgg3v3hfg70.cloudfront.net/TB8475/.jpg" alt="Find the