Multiple Choice
The bar graph shows the number of tickets sold each week by the garden club for their annual flower show. Use the
graph to answer the question(s) . 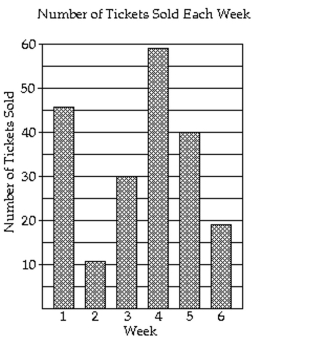
-How many tickets were sold in all?
A) 215 tickets
B) 105 tickets
C) 195 tickets
D) 205 tickets
Correct Answer:

Verified
Correct Answer:
Verified
Q365: Solve.<br>-A checking account had a beginning balance
Q366: Determine whether the product will be positive,
Q367: Solve the problem.<br>-For what value or values
Q368: Use your calculator to find the product.<br>-(27)(-81)<br>A)
Q369: Use your calculator to find the quotient.<br>--666.54
Q371: Solve the problem.<br>-Raya has $154 in her
Q372: Evaluate.<br>-<img src="https://d2lvgg3v3hfg70.cloudfront.net/TB8475/.jpg" alt="Evaluate. - A) 760
Q373: The graph shows the recorded hourly temperatures
Q374: Use your calculator to find the quotient.<br>--129.8
Q375: Find the product.<br>-(-3)(-5)(-3)<br>A) -55<br>B) -45<br>C) 45<br>D) 55