Multiple Choice
The graph shows the recorded hourly temperatures in degrees Fahrenheit at an airport. Use the graph to answer the
question(s) . 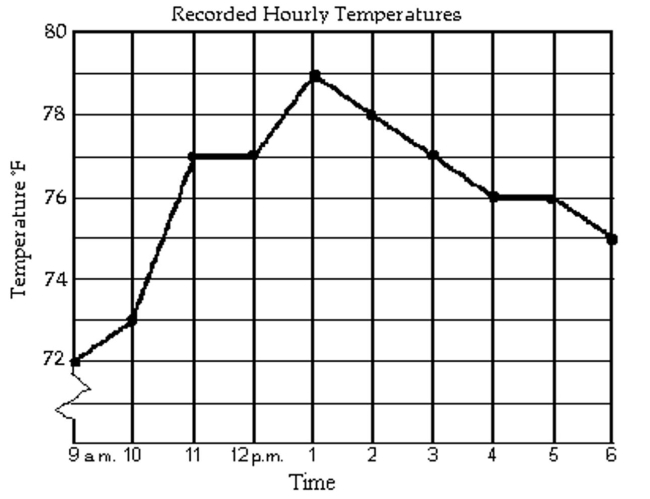
-During which two hour period did the temperature increase the most?
A) 9 a.m. to 11 a.m.
B) 12 p.m. to 2 p.m.
C) 10 a.m. to 11 a.m.
D) 10 a.m. to 12 p.m.
Correct Answer:

Verified
Correct Answer:
Verified
Q368: Use your calculator to find the product.<br>-(27)(-81)<br>A)
Q369: Use your calculator to find the quotient.<br>--666.54
Q370: The bar graph shows the number of
Q371: Solve the problem.<br>-Raya has $154 in her
Q372: Evaluate.<br>-<img src="https://d2lvgg3v3hfg70.cloudfront.net/TB8475/.jpg" alt="Evaluate. - A) 760
Q374: Use your calculator to find the quotient.<br>--129.8
Q375: Find the product.<br>-(-3)(-5)(-3)<br>A) -55<br>B) -45<br>C) 45<br>D) 55
Q376: Evaluate using a number line.<br>-<img src="https://d2lvgg3v3hfg70.cloudfront.net/TB8475/.jpg" alt="Evaluate
Q377: Write the opposite of the number.<br>--9.6<br>A) <img
Q378: Evaluate.<br>-<img src="https://d2lvgg3v3hfg70.cloudfront.net/TB8475/.jpg" alt="Evaluate. - A)