Multiple Choice
Use the REGRESSION feature on a graphing calculator.
-A study was conducted to compare the average time spent in the lab each week versus course grade for computer students. The results are recorded in the table below. 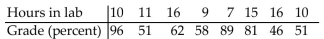 Use linear regression to find a linear function that predicts a student's course grade as a function of the number of hours
Spent in lab.
A) y = 0.930 + 44.3x
B) y = 88.6 - 1.86x
C) y = 44.3 + 0.930x
D) y = 1.86 + 88.6x
Correct Answer:

Verified
Correct Answer:
Verified
Q29: Determine whether the function is linear, constant,
Q31: Find the function value.<br>-Given that <img src="https://d2lvgg3v3hfg70.cloudfront.net/TB8593/.jpg"
Q32: Determine whether the relation represents a function.
Q33: Provide an appropriate response.<br>-The following graph represents
Q34: Solve the problem.<br>-Suppose that $2200 is invested
Q35: Use a calculator to evaluate the expression.
Q37: The graph that follows is the graph
Q38: Provide an appropriate response.<br>-For f(t) = 3t
Q39: Use the REGRESSION feature on a graphing
Q41: Solve the problem.<br>-<img src="https://d2lvgg3v3hfg70.cloudfront.net/TB8593/.jpg" alt="Solve the problem.