Multiple Choice
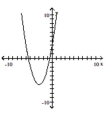
The graph that follows is the graph of a polynomial function. (i) What is the minimum degree of a polynomial function
that could have the graph? (ii) Is the leading coefficient of the polynomial negative or positive?
-
A) 
B) 
C) 
D) 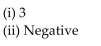 (
(
Correct Answer:

Verified
Correct Answer:
Verified
Q29: Determine whether the function is linear, constant,
Q32: Determine whether the relation represents a function.
Q33: Provide an appropriate response.<br>-The following graph represents
Q34: Solve the problem.<br>-Suppose that $2200 is invested
Q35: Use a calculator to evaluate the expression.
Q36: Use the REGRESSION feature on a graphing
Q38: Provide an appropriate response.<br>-For f(t) = 3t
Q39: Use the REGRESSION feature on a graphing
Q41: Solve the problem.<br>-<img src="https://d2lvgg3v3hfg70.cloudfront.net/TB8593/.jpg" alt="Solve the problem.
Q42: Determine whether the relation represents a function.