Essay
The following frequency distribution shows for a certain high school the number of freshmen,
sophomores, juniors, and seniors who smoke. Construct a bar graph for the data. 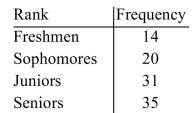
Correct Answer:

Verified
Correct Answer:
Verified
Related Questions
Q73: Select the graph below that best represents
Q74: Which data set would be likely to
Q75: The average hourly wage of employees of
Q76: Find the value for the correlation coefficient
Q77: These data represent the number of students
Q79: Find the median. <img src="https://d2lvgg3v3hfg70.cloudfront.net/TB8446/.jpg" alt="Find the
Q80: Suppose that you find the mean weight
Q81: Five hundred college graduates were asked how
Q82: The table below shows the number of
Q83: Consider the survey question "Do you think