Short Answer
Select the graph below that best represents each description and fill in any blanks. 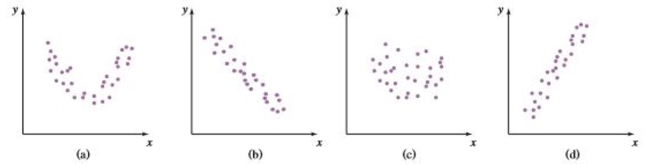 A positive linear relationship exists when the points fall approximately in an
ascending straight line from left to right. In this case as the x values are increasing,
the y values are ________. This relationship is best illustrated by graph ________.
Correct Answer:

Verified
Correct Answer:
Verified
Q68: The average hourly wage of employees of
Q69: For the following data<br>(a)Draw a scatter plot.<br>(b)Find
Q70: Find the midrange. <img src="https://d2lvgg3v3hfg70.cloudfront.net/TB8446/.jpg" alt="Find the
Q71: The data below are the number of
Q72: Draw a bar graph illustrating the change
Q74: Which data set would be likely to
Q75: The average hourly wage of employees of
Q76: Find the value for the correlation coefficient
Q77: These data represent the number of students
Q78: The following frequency distribution shows for a