Essay
Fifty ten-year-olds were monitored to determine the number of hours per week they spent watching
television, surfing the net, and playing video games. The results were used to obtain the frequency
distribution below. Construct a frequency polygon for the data. 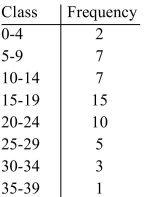
Correct Answer:

Verified
Correct Answer:
Verified
Related Questions
Q24: Based on data compiled by the World
Q25: Find the area under the normal distribution
Q26: Use the box plot to fill in
Q27: An aptitude test has a mean of
Q28: A researcher numbered all of the colleges
Q30: Find the area under the normal distribution
Q31: The is the value that occurs most
Q32: Provided below are the sizes of 15
Q33: The average amount customers at a certain
Q34: Given the following information about test scores,