Essay
Use the box plot to fill in all of the requested information for the test scores it illustrates. 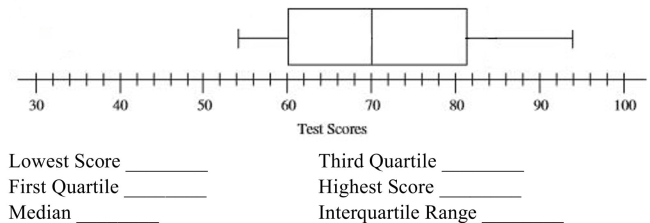
Correct Answer:

Verified
Correct Answer:
Verified
Related Questions
Q21: The graphs below display the average life
Q22: Fifty people participated in a poll to
Q23: Find the range, variance, and standard deviation
Q24: Based on data compiled by the World
Q25: Find the area under the normal distribution
Q27: An aptitude test has a mean of
Q28: A researcher numbered all of the colleges
Q29: Fifty ten-year-olds were monitored to determine the
Q30: Find the area under the normal distribution
Q31: The is the value that occurs most