Essay
The graphs below display the average life expectancy for Americans according to the National
Center for Health Statistics. Which graph would you show if you wanted to convince someone that
the advances of modern medicine will soon have us living to be 150? 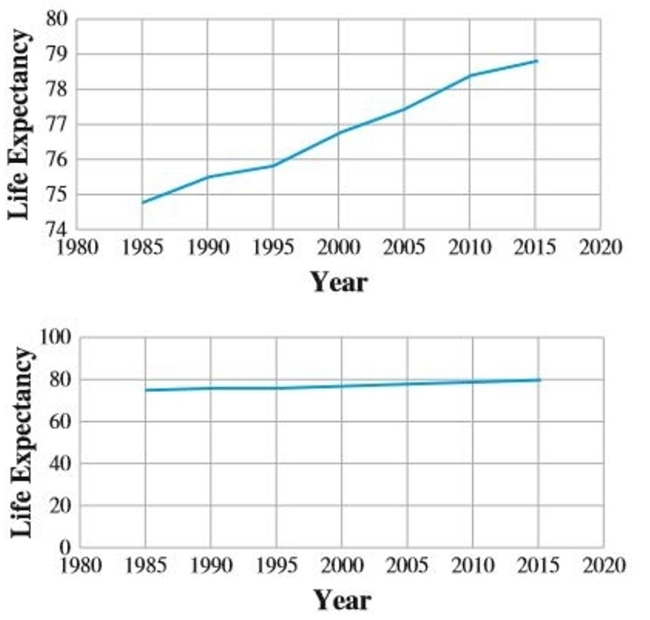
Correct Answer:

Verified
The first. The increase looks ...View Answer
Unlock this answer now
Get Access to more Verified Answers free of charge
Correct Answer:
Verified
View Answer
Unlock this answer now
Get Access to more Verified Answers free of charge
Q110: A standardized test of intelligence is scaled
Q111: A sample is one where members of
Q112: Find the area under the normal distribution
Q113: These data represent the number of gas
Q114: Draw a scatter plot for the data
Q116: To obtain the frequency distribution below, twenty-three
Q117: Fran's percentile rank on an exam in
Q118: Normal distributions are very commonly used for
Q119: Suppose the average size (in square feet)of
Q120: When a population is divided into groups