Essay
These data represent the number of gas stations along a certain 50-mile length of desert road. Draw
a time series graph for the data. 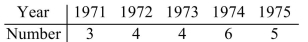
Correct Answer:

Verified
Correct Answer:
Verified
Related Questions
Q108: Find the range, variance, and standard deviation
Q109: Determine whether a correlation coefficient of r
Q110: A standardized test of intelligence is scaled
Q111: A sample is one where members of
Q112: Find the area under the normal distribution
Q114: Draw a scatter plot for the data
Q115: The graphs below display the average life
Q116: To obtain the frequency distribution below, twenty-three
Q117: Fran's percentile rank on an exam in
Q118: Normal distributions are very commonly used for