Multiple Choice
The following table shows data from an epidemiological study.What is the rate difference? 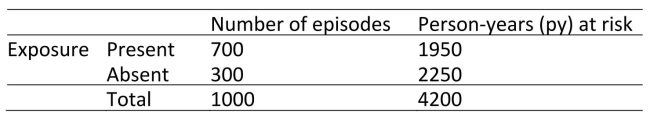
A) 22.6 per 100 py
B) 22.6 per 100,000 py
C) 12.1 per 100,000 py
D) 10.5 per 100 py
E) 2.7
F) 0.37
Correct Answer:

Verified
Correct Answer:
Verified
Related Questions
Q1: What is the population attributable risk in
Q2: In the first 12 years of follow‐up
Q3: In a study to determine whether tonsillectomy
Q4: 1000 adults who presented to their local
Q5: Which of the following factors will influence
Q6: Which of the following measures is most
Q7: The strength of an association between exposure
Q8: To assess the association between Kawasaki syndrome
Q9: A randomised, placebo‐controlled trial was conducted in