Multiple Choice
SCENARIO 2-4
A survey was conducted to determine how people rated the quality of programming available on television.Respondents were asked to rate the overall quality from 0 (no quality at all) to 100 (extremely good quality) .The stem-and-leaf display of the data is shown below.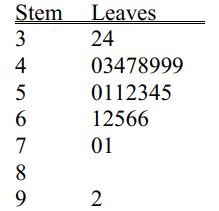
-Referring to Scenario 2-4,what percentage of the respondents rated overall television quality with a rating of 80 or above?
A) 0
B) 4
C) 96
D) 100
Correct Answer:

Verified
Correct Answer:
Verified
Q7: SCENARIO 2-4<br>A survey was conducted to determine
Q8: SCENARIO 2-9<br>The frequency distribution below represents the
Q9: To determine the width of class interval,divide
Q10: In graphing two categorical data,the side-by-side bar
Q11: SCENARIO 2-6<br>A sample of 200 students at
Q13: SCENARIO 2-14 <br>The table below contains the
Q14: In general,grouped frequency distributions should have between
Q15: Given below is the scatter plot of
Q16: If the values of the seventh and
Q17: When studying the simultaneous responses to two