True/False
Given below is the scatter plot of the number of employees and the total revenue ($millions)of 20 U.S.companies.Companies that have higher numbers of employees appear to also have higher total revenue. 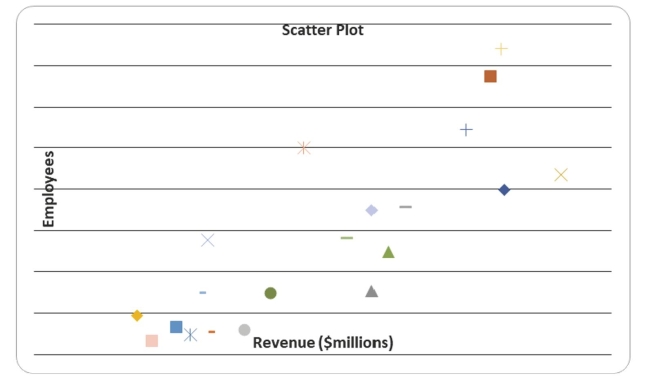
Correct Answer:

Verified
Correct Answer:
Verified
Q18: SCENARIO 2-10<br>The histogram below represents scores achieved
Q54: SCENARIO 2-2<br>2-2 Organizing and Visualizing Variables<br>At a
Q61: SCENARIO 2-10<br>The histogram below represents scores achieved
Q63: One of the developing countries is experiencing
Q97: SCENARIO 2-8<br>The Stem-and-Leaf display represents the number
Q126: SCENARIO 2-6<br>A sample of 200 students at
Q130: True or False: In general, grouped frequency
Q154: Which of the following is appropriate for
Q160: SCENARIO 2-14 <br>The table below contains the
Q160: SCENARIO 2-12<br>The table below contains the opinions