Multiple Choice
SCENARIO 13-1 A large national bank charges local companies for using their services.A bank official reported the results of a regression analysis designed to predict the bank's charges (Y) -- measured in dollars per month -- for services rendered to local companies.One independent variable used to predict service charges to a company is the company's sales revenue (X) -- measured in millions of dollars.Data for 21 companies who use the bank's services were used to fit the model: 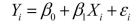 The results of the simple linear regression are provided below.
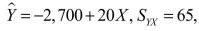
 two-tail p value =0.034 (for testing
-Referring to Scenario 13-1, interpret the estimate of  the standard deviation of the random error term (standard error of the estimate) in the model.
A) About 95% of the observed service charges fall within $65 of the least squares line.
B) About 95% of the observed service charges equal their corresponding predicted values.
C) About 95% of the observed service charges fall within $130 of the least squares line.
D) For every $1 million increase in sales revenue, we expect a service charge to increase $65.
Correct Answer:

Verified
Correct Answer:
Verified
Q11: SCENARIO 13-4<br>The managers of a brokerage firm
Q63: Which of the following assumptions concerning the
Q119: SCENARIO 13-13<br>In this era of tough economic
Q121: SCENARIO 13-9<br>It is believed that, the average
Q125: SCENARIO 13-4<br>The managers of a brokerage firm
Q170: SCENARIO 13-12 The manager of the purchasing
Q172: SCENARIO 13-10 The management of a chain
Q173: Rejection of the null hypothesis in a
Q176: SCENARIO 13-10 The management of a chain
Q192: SCENARIO 13-12<br>The manager of the purchasing department