Multiple Choice
SCENARIO 19-3 A quality control analyst for a light bulb manufacturer is concerned that the time it takes to produce a batch of light bulbs is too erratic.Accordingly, the analyst randomly surveys 10 production periods each day for 14 days and records the sample mean and range for each day. 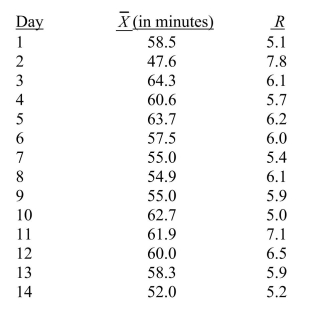
-Referring to Scenario 19-3, suppose the analyst constructs an  chart to see if the production process is in-control.Which expression best describes this chart?
A) In-control
B) Increasing trend
C) Decreasing trend
D) Individual outliers
Correct Answer:

Verified
Correct Answer:
Verified
Q1: _ causes of variation are correctable without
Q23: True or False: Total Productive Maintenance focuses
Q35: True or False: The focus of Lean
Q36: The cause of variation that can be
Q37: True or False: SS method is among
Q45: SCENARIO 19-5<br>A manufacturer of computer disks took
Q71: True or False: SMED establishes ways to
Q72: True or False: Quick Changeover Techniques involve
Q74: True or False: Quick Changeover Techniques is
Q81: True or False: TPM establishes ways to