Multiple Choice
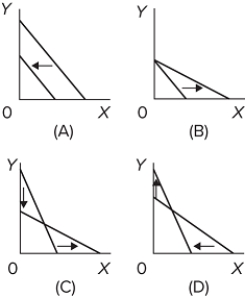 Which of the graphs shows a change in the price of X, but no changes in the price of Y and in the buyer's budget?
A) graph A
B) graph B
C) graph C
D) graph D
Correct Answer:

Verified
Correct Answer:
Verified
Q40: If total utility increases as consumption of
Q41: Other things equal, an increase in the
Q42: In 2015 the federal government began requiring
Q43: <img src="https://d2lvgg3v3hfg70.cloudfront.net/TB8602/.jpg" alt=" Refer to the
Q44: <img src="https://d2lvgg3v3hfg70.cloudfront.net/TB8602/.jpg" alt=" Graph I above
Q46: What are two related effects that combine
Q47: The budget line shows<br>A)the amount of product
Q48: When the price of a product falls
Q49: <img src="https://d2lvgg3v3hfg70.cloudfront.net/TB8602/.jpg" alt=" Refer to the
Q50: When the federal government started requiring restaurants