Multiple Choice
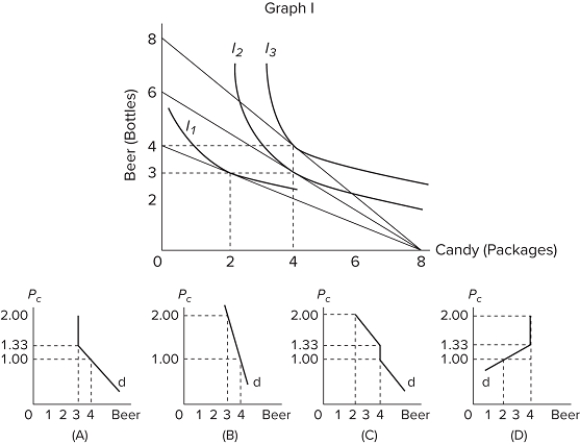 Graph I above shows E.T.'s equilibrium combinations of beer and candy for three different prices of beer. (I₁, I₂, and I₃ are indifference curves. The price of a package of candy is constant at $1.00.) Letting Pc represent the price of beer, which demand curve (d) above is consistent with graph I?
A) graph A
B) graph B
C) graph C
D) graph D
Correct Answer:

Verified
Correct Answer:
Verified
Q39: The slope of a budget line reflects
Q40: If total utility increases as consumption of
Q41: Other things equal, an increase in the
Q42: In 2015 the federal government began requiring
Q43: <img src="https://d2lvgg3v3hfg70.cloudfront.net/TB8602/.jpg" alt=" Refer to the
Q45: <img src="https://d2lvgg3v3hfg70.cloudfront.net/TB8602/.jpg" alt=" Which of the
Q46: What are two related effects that combine
Q47: The budget line shows<br>A)the amount of product
Q48: When the price of a product falls
Q49: <img src="https://d2lvgg3v3hfg70.cloudfront.net/TB8602/.jpg" alt=" Refer to the