Multiple Choice
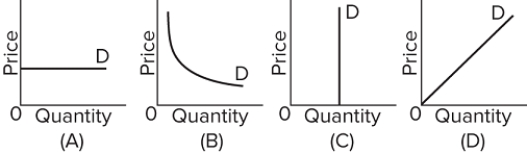 Refer to the graphs above. A price increase from $20 to $40 causes quantity demanded to decrease from 100 units to 50 units. Which graph best illustrates the demand for this good?
A) graph A
B) graph B
C) graph C
D) graph D
Correct Answer:

Verified
Correct Answer:
Verified
Q380: If the University Chamber Music Society decides
Q381: The income elasticity of demand for food
Q382: A demand curve that is parallel to
Q383: Other things the same, if a price
Q384: A computer company is considering lowering the
Q386: If the percentage change in quantity demanded
Q387: <img src="https://d2lvgg3v3hfg70.cloudfront.net/TB8602/.jpg" alt=" The diagram concerns
Q388: <img src="https://d2lvgg3v3hfg70.cloudfront.net/TB8602/.jpg" alt=" Refer to the
Q389: <img src="https://d2lvgg3v3hfg70.cloudfront.net/TB8602/.jpg" alt=" Refer to the
Q390: The larger the coefficient of price elasticity