Multiple Choice
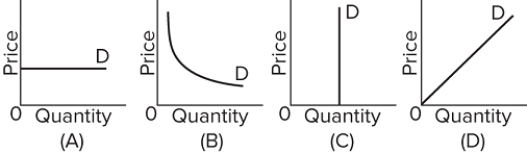 Refer to the graphs above. Which one shows demand with a price-elasticity coefficient equal to zero?
A) graph A
B) graph B
C) graph C
D) graph D
Correct Answer:

Verified
Correct Answer:
Verified
Q383: Other things the same, if a price
Q384: A computer company is considering lowering the
Q385: <img src="https://d2lvgg3v3hfg70.cloudfront.net/TB8602/.jpg" alt=" Refer to the
Q386: If the percentage change in quantity demanded
Q387: <img src="https://d2lvgg3v3hfg70.cloudfront.net/TB8602/.jpg" alt=" The diagram concerns
Q389: <img src="https://d2lvgg3v3hfg70.cloudfront.net/TB8602/.jpg" alt=" Refer to the
Q390: The larger the coefficient of price elasticity
Q391: Explain how each of four determinants of
Q392: Why is the price elasticity of demand
Q393: Answer the question on the basis of