Multiple Choice
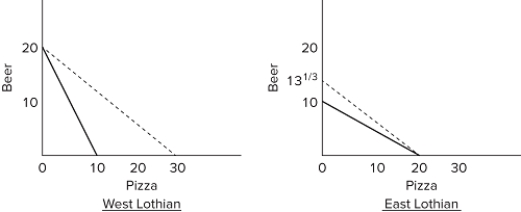 In the accompanying diagrams, solid lines are production possibilities curves, and the dashed lines are trading possibilities curves. The trading possibilities curves imply that
A) both countries have a trade surplus that will result in economic growth.
B) the domestic production possibilities curves entail unemployment and/or the domestic misallocation of resources.
C) world resources will be allocated more efficiently if the two nations specialize and trade based on comparative advantage.
D) both nations will be worse off as a result of international specialization and trade.
Correct Answer:

Verified
Correct Answer:
Verified
Q87: Which country is the United States' largest
Q176: <img src="https://d2lvgg3v3hfg70.cloudfront.net/TB8602/.jpg" alt=" Refer to the
Q177: <img src="https://d2lvgg3v3hfg70.cloudfront.net/TB8602/.jpg" alt=" Refer to the
Q178: The benefits to trading nations based on
Q179: <img src="https://d2lvgg3v3hfg70.cloudfront.net/TB8602/.jpg" alt=" The accompanying tables
Q180: What is the eurozone? How has the
Q182: <img src="https://d2lvgg3v3hfg70.cloudfront.net/TB8602/.jpg" alt=" Refer to the
Q184: <img src="https://d2lvgg3v3hfg70.cloudfront.net/TB8602/.jpg" alt=" The accompanying tables
Q186: In order for mutually beneficial trade to
Q281: What are the major imports and exports