Multiple Choice
 Refer to the graph, which shows the import demand and export supply curves for two nations that produce a certain product. The import demand curves for the two nations are represented by lines
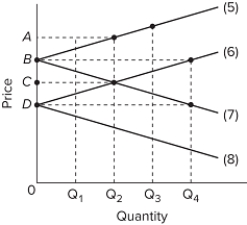
A) 5 and 6.
B) 5 and 7.
C) 6 and 8.
D) 7 and 8.
Correct Answer:

Verified
Correct Answer:
Verified
Q87: Which country is the United States' largest
Q177: <img src="https://d2lvgg3v3hfg70.cloudfront.net/TB8602/.jpg" alt=" Refer to the
Q178: The benefits to trading nations based on
Q179: <img src="https://d2lvgg3v3hfg70.cloudfront.net/TB8602/.jpg" alt=" The accompanying tables
Q180: What is the eurozone? How has the
Q181: <img src="https://d2lvgg3v3hfg70.cloudfront.net/TB8602/.jpg" alt=" In the accompanying
Q184: <img src="https://d2lvgg3v3hfg70.cloudfront.net/TB8602/.jpg" alt=" The accompanying tables
Q186: In order for mutually beneficial trade to
Q187: <img src="https://d2lvgg3v3hfg70.cloudfront.net/TB8602/.jpg" alt=" The accompanying productivity
Q281: What are the major imports and exports