Multiple Choice
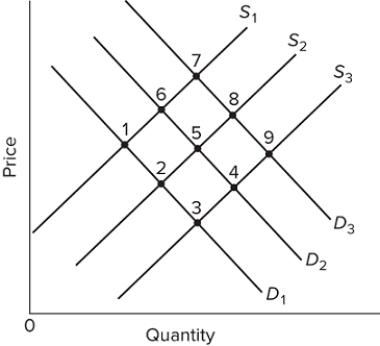 Refer to the graph of the supply and demand for agricultural products. Which of the following best describes the long-run decline of the U.S. agricultural industry?
A) a shift in supply from S₁ to S₂ and a shift in demand from D₂ to D₁
B) a shift in supply from S₁ to S₃ and a shift in demand from D₁ to D₂
C) a shift in supply from S₃ to S₁ and a shift in demand from D₁ to D₃
D) a shift in supply from S₁ to S₂ and a shift in demand from D₃ to D₁
Correct Answer:

Verified
Correct Answer:
Verified
Q220: Increases in incomes usually result in more
Q221: Public choice theory would suggest that the
Q222: The misallocation of resources associated with price
Q223: Due to high fixed costs relative to
Q224: Ward Planter exclusively grew soybeans from 2011
Q226: A source of demand volatility for agricultural
Q227: A declining parity ratio implies that the<br>A)prices
Q228: Incomes of U.S. farmers are adversely affected
Q229: <img src="https://d2lvgg3v3hfg70.cloudfront.net/TB8602/.jpg" alt=" Refer to the
Q230: Which of the following statements is correct?<br>A)The