Multiple Choice
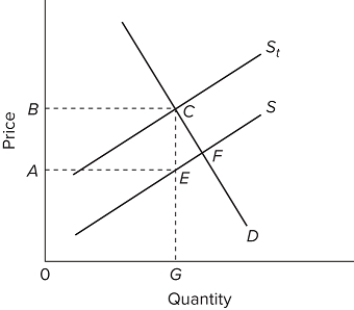 In the figure, S is the before-tax supply curve and Sₜ is the supply curve after an excise tax is imposed. The efficiency loss of this tax will be area
A) ABCE.
B) ABCE + ECF.
C) 0 AEG.
D) ECF.
Correct Answer:

Verified
Correct Answer:
Verified
Q25: One difference between sales and excise taxes
Q26: The tax that is most difficult to
Q27: Education is the largest expenditure item for
Q28: (Advanced analysis)The equations for the demand and
Q29: <img src="https://d2lvgg3v3hfg70.cloudfront.net/TB8602/.jpg" alt=" Refer to the
Q31: Economists agree that corporations always shift the
Q32: About two-thirds of all federal spending is
Q33: <img src="https://d2lvgg3v3hfg70.cloudfront.net/TB8602/.jpg" alt=" The table shows
Q34: Which of the following is the most
Q35: <img src="https://d2lvgg3v3hfg70.cloudfront.net/TB8602/.jpg" alt=" The graph illustrates