Multiple Choice
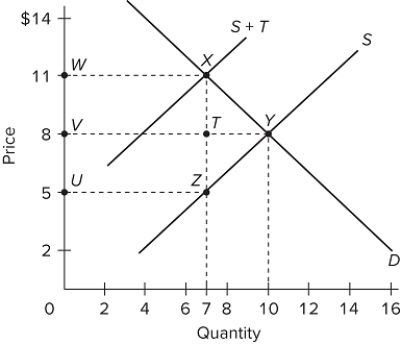 The graph illustrates the market for a product on which an excise tax has been imposed by government. How much is the efficiency (or deadweight) loss due to the excise tax?
A) $6
B) $9
C) $18
D) $21
Correct Answer:

Verified
Correct Answer:
Verified
Q30: <img src="https://d2lvgg3v3hfg70.cloudfront.net/TB8602/.jpg" alt=" In the figure,
Q31: Economists agree that corporations always shift the
Q32: About two-thirds of all federal spending is
Q33: <img src="https://d2lvgg3v3hfg70.cloudfront.net/TB8602/.jpg" alt=" The table shows
Q34: Which of the following is the most
Q36: If the marginal tax rate is 25
Q37: <img src="https://d2lvgg3v3hfg70.cloudfront.net/TB8602/.jpg" alt=" The graph illustrates
Q38: In determining one's personal income tax, taxable
Q39: Given supply, the more inelastic the demand
Q40: In 2016, the top 1 percent of