Multiple Choice
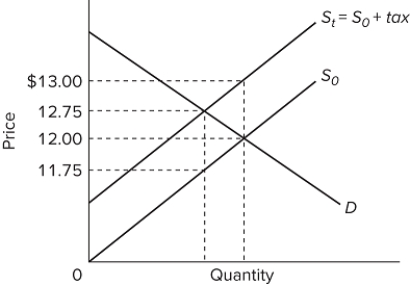 The graph shows the supply curve for a product before tax ( S ₀ ) and after an excise tax is imposed ( S ₁) . If 500 units of the product are sold after the tax is imposed, the amount of tax revenue going to the government is
A) $125.
B) $250.
C) $375.
D) $500.
Correct Answer:

Verified
Correct Answer:
Verified
Q241: Most economists believe that property taxes<br>A)should be
Q242: <img src="https://d2lvgg3v3hfg70.cloudfront.net/TB8602/.jpg" alt=" Refer to the
Q243: The main difference between sales and excise
Q244: If the demand for a product is
Q245: <img src="https://d2lvgg3v3hfg70.cloudfront.net/TB8602/.jpg" alt=" Refer to the
Q247: Suppose that government imposes a specific excise
Q248: The federal personal income tax<br>A)has a regressive
Q249: <img src="https://d2lvgg3v3hfg70.cloudfront.net/TB8602/.jpg" alt=" In the diagram,
Q250: Which statement best describes the overall tax
Q251: If the supply of a product is