Multiple Choice
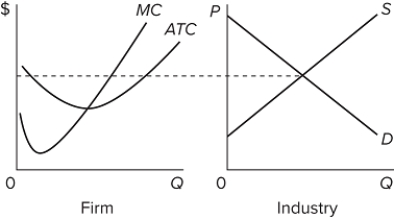 The accompanying graphs are for a purely competitive market in the short run. The graphs suggest that in the long run, as automatic market adjustments occur, the demand curve facing the individual firm will
A) shift up.
B) shift down.
C) not shift.
D) slope downward.
Correct Answer:

Verified
Correct Answer:
Verified
Q123: The average life expectancy of a U.S.
Q124: <img src="https://d2lvgg3v3hfg70.cloudfront.net/TB8602/.jpg" alt=" Line (2)in the
Q125: In a decreasing-cost industry,<br>A)there will be no
Q126: Productive efficiency refers to<br>A)cost minimization, where P
Q127: What is the concept of creative destruction?
Q129: <img src="https://d2lvgg3v3hfg70.cloudfront.net/TB8602/.jpg" alt=" The provided graph
Q130: <img src="https://d2lvgg3v3hfg70.cloudfront.net/TB8602/.jpg" alt=" The diagram shows
Q131: The short-run supply curve of a purely
Q132: Suppose that the corn market is purely
Q133: Competitive firms will always try to earn