Multiple Choice
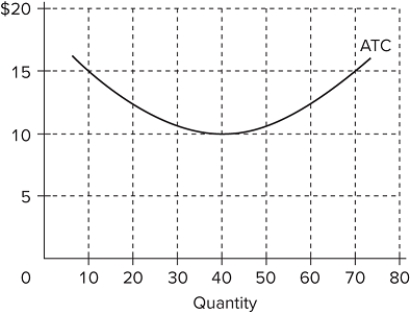
 The diagram shows the average total cost curve for a purely competitive firm. At the long-run equilibrium level of output, this firm's economic profit
A) is zero.
B) is $400.
C) is $200.
D) cannot be determined from the information provided.
Correct Answer:

Verified
Correct Answer:
Verified
Q125: In a decreasing-cost industry,<br>A)there will be no
Q126: Productive efficiency refers to<br>A)cost minimization, where P
Q127: What is the concept of creative destruction?
Q128: <img src="https://d2lvgg3v3hfg70.cloudfront.net/TB8602/.jpg" alt=" The accompanying graphs
Q129: <img src="https://d2lvgg3v3hfg70.cloudfront.net/TB8602/.jpg" alt=" The provided graph
Q131: The short-run supply curve of a purely
Q132: Suppose that the corn market is purely
Q133: Competitive firms will always try to earn
Q134: Which would indicate that a firm is
Q135: From the viewpoint of a firm, competition