Multiple Choice
 The accompanying graph shows the long-run supply and demand curves in a purely competitive market. We know that in this market, the marginal
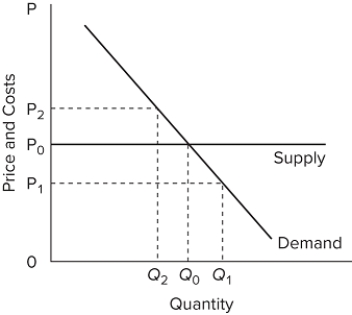
A) cost equals marginal benefit at P₁ Q₁.
B) benefit exceeds marginal cost at the output level of Q₂.
C) cost exceeds marginal benefit at the output level of Q₂.
D) benefit equals marginal cost at all points on the supply curve.
Correct Answer:

Verified
Correct Answer:
Verified
Q206: We would expect an industry to expand
Q207: Suppose losses cause industry X to contract
Q208: Approximately what percentage of start-up firms in
Q209: Which firms will be the most likely
Q210: If for a firm P = minimum
Q212: "The long-run industry supply curve in a
Q213: <img src="https://d2lvgg3v3hfg70.cloudfront.net/TB8602/.jpg" alt=" The accompanying graph
Q214: When a profit-maximizing competitive firm decides to
Q215: Suppose that Betty's Beads is a typical
Q216: <img src="https://d2lvgg3v3hfg70.cloudfront.net/TB8602/.jpg" alt=" The accompanying graph