Multiple Choice
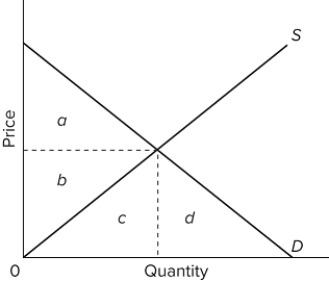 The accompanying graph represents the purely competitive market for a product. When the market is at equilibrium, the consumer surplus would be represented by the area
A) a + b + c + d.
B) a + b + c.
C) a.
D) b + c.
Correct Answer:

Verified
Correct Answer:
Verified
Q208: Approximately what percentage of start-up firms in
Q209: Which firms will be the most likely
Q210: If for a firm P = minimum
Q211: <img src="https://d2lvgg3v3hfg70.cloudfront.net/TB8602/.jpg" alt=" The accompanying graph
Q212: "The long-run industry supply curve in a
Q214: When a profit-maximizing competitive firm decides to
Q215: Suppose that Betty's Beads is a typical
Q216: <img src="https://d2lvgg3v3hfg70.cloudfront.net/TB8602/.jpg" alt=" The accompanying graph
Q217: The costs of competition's creative destruction are
Q218: When entrepreneurs in competitive industries successfully innovate