Multiple Choice
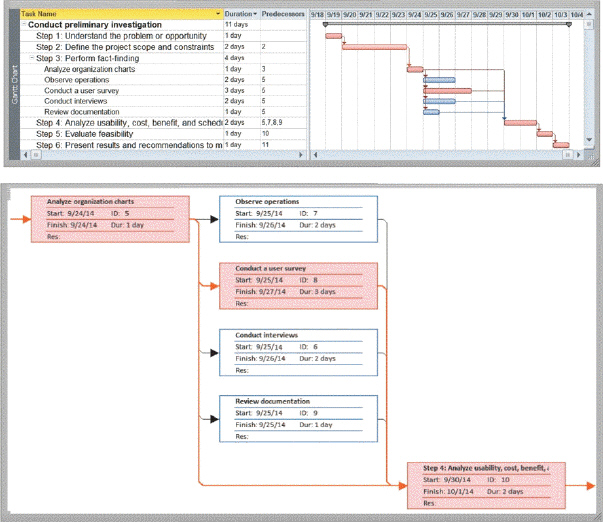 As shown in the accompanying figure, a Gantt chart, developed by Henry Gantt, is which of the following?
A) diagram that graphically shows how actors interact with an information system
B) tool that graphically shows the flow of data in a system
C) bar chart that uses horizontal bars to show project phases or activities
D) table that lists a variety of conditions and the actions that correspond to them
Correct Answer:

Verified
Correct Answer:
Verified
Q79: Systems analysts and other IT professionals use
Q135: The advantage of the direct conversion strategy
Q155: COGNITIVE ASSESSMENT What is another term for
Q156: COGNITIVE ASSESSMENT Which conversion strategy has as
Q158: In sequence, traditional system development contains five
Q161: Critical Thinking Questions Case 12-1 You have
Q162: COGNITIVE ASSESSMENT During which phase in the
Q163: COGNITIVE ASSESSMENT What term is used to
Q164: COGNITIVE ASSESSMENT Which of the following is
Q165: COGNITIVE ASSESSMENT Which of the following is