Multiple Choice
FIGURE 2-10
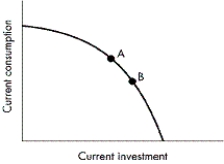
-Refer to Figure 2-10. Which of the following best explains how the society producing breadfruit and fish could have moved from curve AA to curve BB?
A) A new school of fish was located.
B) The society experienced significant immigration of labour.
C) The society reallocated its resources toward the production of a greater quantity of breadfruit.
D) The society reallocated its resources toward catching a greater number of fish.
Correct Answer:

Verified
Correct Answer:
Verified
Q8: Consumer sovereignty means that consumers vote with
Q41: Any output combination outside the production possibilities
Q142: FIGURE 2-3<br> <img src="https://d2lvgg3v3hfg70.cloudfront.net/TB5767/.jpg" alt="FIGURE 2-3
Q143: FIGURE 2-7<br> <img src="https://d2lvgg3v3hfg70.cloudfront.net/TB5767/.jpg" alt="FIGURE 2-7
Q145: FIGURE 2-6<br> <img src="https://d2lvgg3v3hfg70.cloudfront.net/TB5767/.jpg" alt="FIGURE 2-6
Q148: FIGURE 2-12<br> <img src="https://d2lvgg3v3hfg70.cloudfront.net/TB5767/.jpg" alt="FIGURE 2-12
Q149: Which of the following will NOT shift
Q150: FIGURE 2-5<br> <img src="https://d2lvgg3v3hfg70.cloudfront.net/TB5767/.jpg" alt="FIGURE 2-5
Q151: FIGURE 2-11<br> <img src="https://d2lvgg3v3hfg70.cloudfront.net/TB5767/.jpg" alt="FIGURE 2-11
Q152: FIGURE 2-13<br> <img src="https://d2lvgg3v3hfg70.cloudfront.net/TB5767/.jpg" alt="FIGURE 2-13