Multiple Choice
FIGURE 2-13
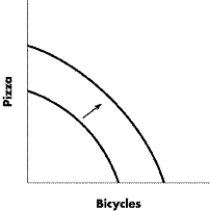
-Refer to Figure 2-13. Which of the following is a possible explanation for the shift of the production possibilities curve illustrated above?
A) an increase in the number of idle factories
B) a technological advance that affects both pizza and bicycle production
C) a decrease in the quantity of labour available due to emigration
D) a technological advance that affects only bicycle production
Correct Answer:

Verified
Correct Answer:
Verified
Q46: In a market economy, prices help determine
Q147: FIGURE 2-10<br> <img src="https://d2lvgg3v3hfg70.cloudfront.net/TB5767/.jpg" alt="FIGURE 2-10
Q148: FIGURE 2-12<br> <img src="https://d2lvgg3v3hfg70.cloudfront.net/TB5767/.jpg" alt="FIGURE 2-12
Q149: Which of the following will NOT shift
Q150: FIGURE 2-5<br> <img src="https://d2lvgg3v3hfg70.cloudfront.net/TB5767/.jpg" alt="FIGURE 2-5
Q151: FIGURE 2-11<br> <img src="https://d2lvgg3v3hfg70.cloudfront.net/TB5767/.jpg" alt="FIGURE 2-11
Q153: Lumber prices fall in Calgary, Alberta, because
Q154: If the production possibilities curve is a
Q155: FIGURE 2-3<br> <img src="https://d2lvgg3v3hfg70.cloudfront.net/TB5767/.jpg" alt="FIGURE 2-3
Q157: FIGURE 2-2<br> <img src="https://d2lvgg3v3hfg70.cloudfront.net/TB5767/.jpg" alt="FIGURE 2-2