Multiple Choice
FIGURE 5-1
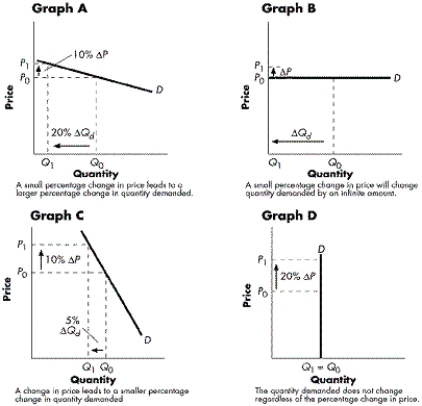
-Refer to Figure 5-1. What graph best illustrates a perfectly inelastic demand curve?
A) Graph A
B) Graph B
C) Graph C
D) Graph D
Correct Answer:

Verified
Correct Answer:
Verified
Related Questions
Q77: FIGURE 5-2<br> <img src="https://d2lvgg3v3hfg70.cloudfront.net/TB5767/.jpg" alt="FIGURE 5-2
Q80: A tax is imposed on wine. Under
Q81: A recent study at a liberal arts
Q83: Which of the following will have the
Q84: Suppose that a 20 percent increase in
Q85: Which of the following statements best describes
Q86: The elasticity in the vicinity of five
Q101: A perfectly inelastic supply curve is vertical.
Q211: If a consumer's total expenditure on a
Q223: A decrease in price will cause a